
Andrew Bohnert
Data Analyst
About Me
Former high school band director transitioning into data analytics with expertise in data-driven performance assessment and reporting, leadership, and project management. Skilled in SQL (Structured Query Language), Google Sheets, and Power BI for analyzing project data, identifying trends, and improving efficiency. Strong problem-solving and critical thinking abilities, seeking to utilize data insights to bring business improvements.
Programs and Skills

Program Knowledge: SQL, MySQL, PostgreSQL, Google Sheets, Power BI, Excel, Tableau, PythonSkillsets: Data clean-up, exploratory and statistical analysis, hypothesis testing, data visualization, project management, and data-driven storytelling.
Projects
Exoplanet Analysis: Star Mass and Planet Count
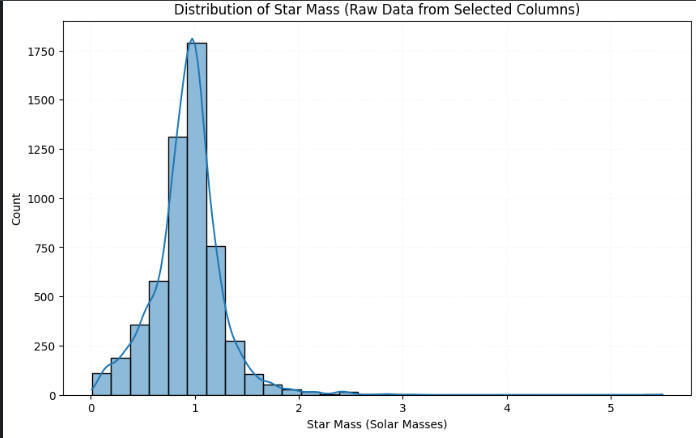
This project investigates the intriguing relationship between a star's mass and the number of exoplanets it hosts. By analyzing observational data, the goal was to uncover statistical probabilities and potential correlations that shed light on how planetary systems form and evolve around different types of stars.
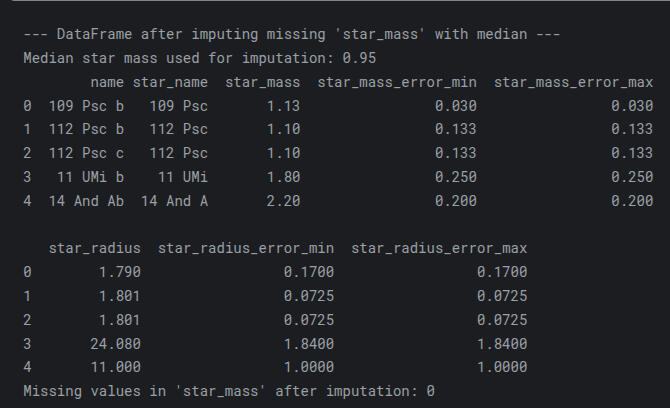
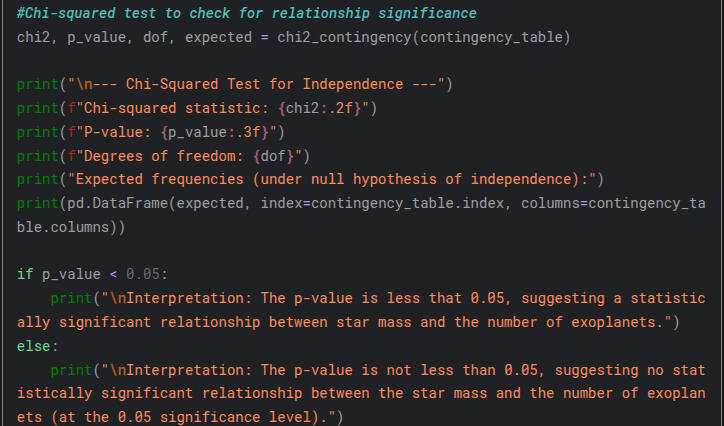
The analysis revealed statistically significant relationship between star mass and the number of exoplanets, as supported by the Chi-squared test.To read a full discussion of the project please check out the LinkedIn Article below. I have also included a link to the Kaggle Notebook if you want to check my coding directly.
LinkedIn Article
Kaggle Notebook Link
Pokemon Stats Analysis Dashboard
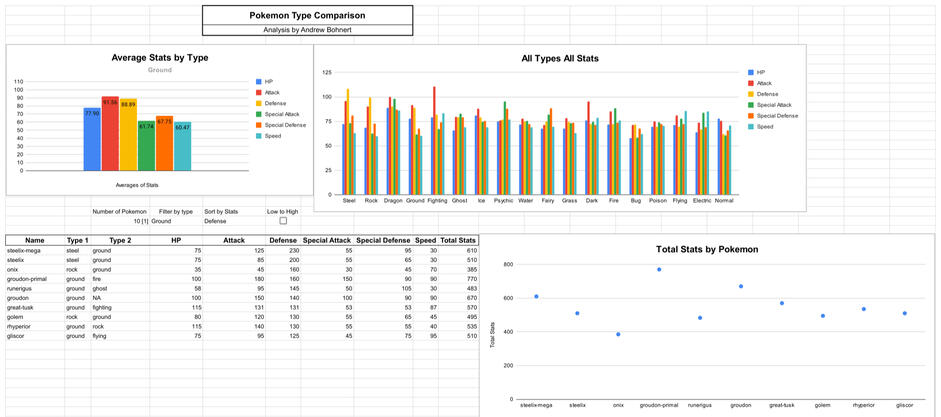
My analysis focused on comparing Pokemon types and individual Pokemon within those types based on their stats, aiming to identify the strongest types and the strongest/weakest Pokemon for each stat. This was performed using a dataset of 1303 Pokemon across 19 types, each with 6 distinct stats.LinkedIn Article
Dashboard Link
Interactive Iris Species Analysis
The main focus of my analysis was the relationship between the petal and sepal measurements of the three different species of irises.
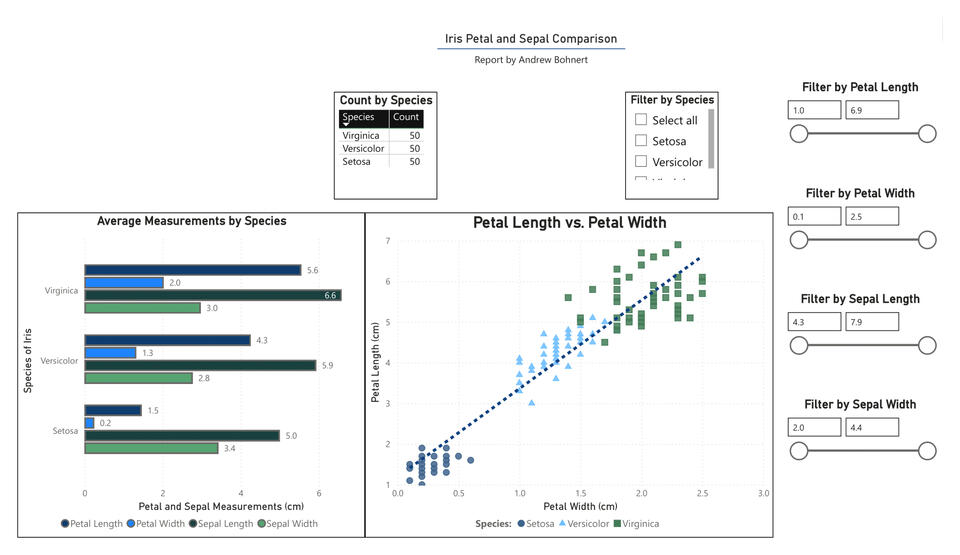
I concluded that the Setosa species was the smallest overall with the lowest level of varience whereas the Virginica was the largest and had a significantly larger variance.LinkedIn Article
Presentation Link
Penguin Size Analysis Project
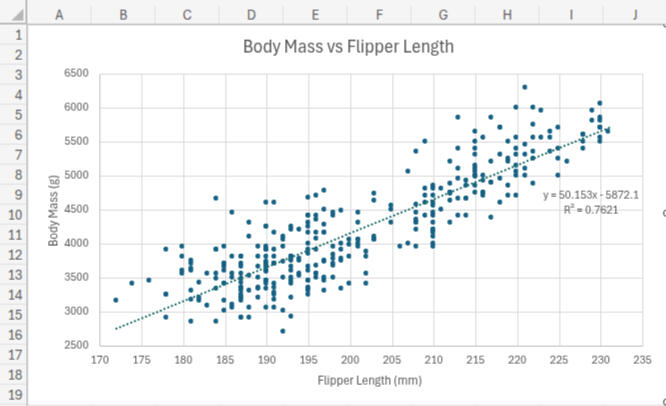
This analysis was used to identify correlations between different species of penguins. The dataset contains measurements of flipper length, body mass, culmen lengths and depths.I chose to further analyze and model data with the flipper size and the body mass measurements. I created a scatter plot of the data and a separate scatter plot for the residuals to calculate the statistical relevance.The model performed exceedingly well, showing a strong correlation between flipper size and the body mass.
LinkedIn Article
Excel Link
Employee Attrition Project
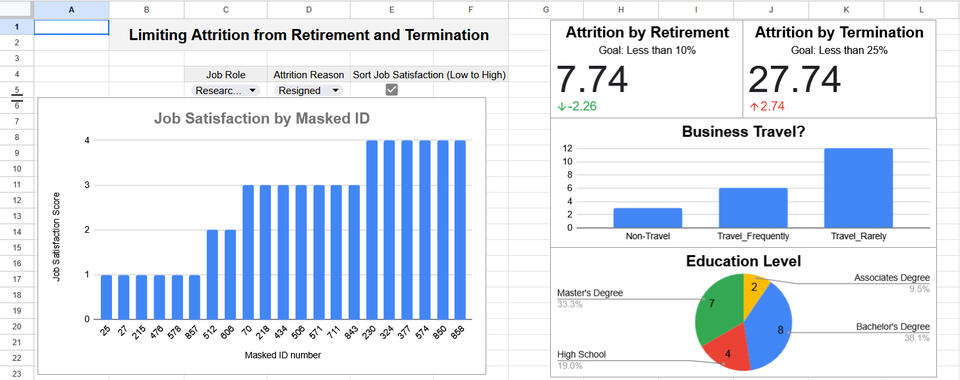
The manager for this project was requesting numerous visualizations about the employees and their attrition reasons. The goals were to limit attrition by retirement to less than 10% and by termination to less than 25%.The finding showed successful KPIs for the retirement however the termination KPI was too high. There were a higher number of lab techs and research scientist terminations than those of the other job roles. This seemed to be a higher factor compared with the education level. A correlation matrix could be drawn to see which attributes had the highest impact on the different methods of attrition.
LinkedIn Article
Dashboard Link